
Two years ago, I wrote about the virtues of monitoring. A lot has changed, a lot has improved, and I’ve certainly learned a lot since I wrote that initial overview on monitoring as a whole.
There have been a lot of improvements to existing tools, and new players entered the market of monitoring. Infrastructure as a whole got more and more interesting for service business around them.
On the other hand, awareness for monitoring, good metrics, logging and the like has been rising significantly.
At the same time #monitoringsucks raised awareness that a lot of monitoring tools are still stuck in the late nineties when it comes to user interface and the way they work.
Independent of new and old tools, I’ve had the pleasure of learning a lot more about the real virtues of monitoring, about how it affects daily work and how it evolves over time. This post is about discussing some of these insights.
Monitoring all the way down
When you start monitoring even just small parts of an application, the need for more detail and for information about what’s going on in a system arises quickly. You start with an innocent number of application level metrics, add metrics for database and external API latencies, start tracking system level and business metrics.
As you add monitoring to one layer of the system, the need to get more insight into the layer below comes up sooner or later.
One layer has just been tackled recently in a way that’s accessible for anyone: communication between services on the network. Boundary has built some pretty cool monitoring stuff that gives you incredibly detailed insight into how services talk to each other, by way of their protocol, how network traffic from inside and outside a network develops over time, and all that down to the second.
The real time view is pretty spectacular to behold.

If you go down even further on a single host, you get to the level where you can monitor disk latencies.
Or you could measure the effect of screaming at a disk array of a running system. dtrace is a pretty incredible tool, and I hope to see it spread and become widely available on Linux systems. It allows you to inject instrumentation into arbitrary parts of the host system, making it possible measure any system call without a lot of overhead.
Heck, even our customer support tool allows us to track metrics for response times, how many tickets and for how long each staff member handled.

It’s easy to start obsessing about monitoring and metrics, but there comes a time, when you either realize that you’ve obsessed for all the right reasons, or you add more monitoring.
Mo’ monitoring, mo’ problems
The crux of monitoring more layers of a system is that with more monitoring, you can and will detect more issues.
Consider Boundary, for example. It gives you insight into a layer you haven’t had insight before, at least not at that granular level. For example, round trip times of liveness traffic in a RabbitMQ cluster.

This gives you a whole new pile of data to obsess about. It’s good because that insight is very valuable. But it requires more attention, and more issues require investigation.
You also need to learn how a system behaving normally is reflected in those new systems, and what constitutes unusual behaviour. It takes time to learn and to interpret the data correctly.
In the long run though, that investment is well worth it.
Monitoring is an ongoing process
When we started adding monitoring to Travis CI, we started small. But we quickly realized what metrics really matter and what parts of the application and the infrastructure around it needs more insight, more metrics, more logging.
With every new component deployed to production, new metrics need to be maintained, more logging and new alerting need to be put in place.
The same is true for new parts of the infrastructure. With every new system or service added, new data needs to be collected to ensure the service is running smoothly.
A lot of the experience of what metrics are important there and which aren’t, it’s something that develops over time. Metrics can come and go, the requirements for metrics are subject to change, just as they are for code.
As you add new metrics, old metrics might become less useful, or you need more metrics in other parts of the setup to make sense of the new ones.
It’s a constant process of refining the data you need to have the best possible insight into a running system.
Monitoring can affect production systems
The more data you collect, with higher and higher resolution, the more you run the risk of affecting a running system. Business metrics regularly pulled from the database can become a burden on the database that’s supposed to serve your customers.
Pulling data out of running systems is a traditional approach to monitoring, one that’s unlikely to go away any time soon. However, it’s an approach that’s less and less feasible as you increase resolution of your data.
Guaranteeing that this collection process is low on resources is hard. It’s even harder to get a system up and running that can handle high-resolution data from a lot of services sent concurrently.
So new approaches have started to pop up to tackle this problem. Instead of pulling data from running processes, the processes themselves collect data and regularly push it to aggregation services which in turn send the data to a system for further aggregation, graphing, and the like.
StatsD is without a doubt the most popular one, and it has sparked a ton of forks in different languages
Instead of relying on TCP with its long connection handshakes and timeouts, StatsD uses UDP. The processes sending data to it stuff short messages into a UDP socket without worrying about whether or not the data arrives.
If some data doesn’t make it because of network issues, that only leaves a small dent. It’s more important for the system to serve customers than for it to wait around for the aggregation service to become available again.
While StatsD solves the problem of easily collecting and aggregating data without affecting production systems, there’s now the problem of being able to inspect the high-resolution data in meaningful ways. Historical analysis and alerting on high-resolution data becomes a whole new challenge.
Riemann has popularized looking at monitoring data as a stream, to which you can apply queries, and form reactions based on those queries. You can move the data window inside the stream back and forth, so you can compare data in a historical context before deciding on whether it’s worth an alert or not.
Systems like StatsD and Riemann make it a lot easier for systems to aggregate data without having to rely on polling. Services can just transmit their data without worrying much about how and where they’re used for other purposes like log aggregation, graphing or alerting.
The important realization is that with increasing need for scalability and distributed systems, software needs to be built with monitoring in mind.
Imagine RabbitMQ that instead of you having to poll the data from it, sends its metrics as a message at a configurable interval to a configurable fanout. You can choose to consume the data and submit it to a system like StatsD or Riemann, or you can ignore it and the broker will just discard the data.
Who’s monitoring the monitoring?
Another fallacy of monitoring is that it needs to be reliable. For it to be fully reliable it needs to be monitored. Wait, what?
Every process that is required to aggregate metrics, to trigger alerts, to analyze logs needs to be running for the system to work properly.
So monitoring in turns needs its own supervision to make sure it’s working at all times. As monitoring grows it requires maintenance and operations to take care of it.
Which makes it a bit of a burden for small teams.
Lots of new companies have sprung into life serving this need. Instead of having to worry about running services for logs, metrics and alerting by themselves, it can be left to companies who are more experienced in running them.
Librato Metrics, Papertrail, OpsGenie, LogEntries, Instrumental, NewRelic, DataDog, to name a few. Other companies take the burden of having to run your own Graphite system away from you.
It’s been interesting to see new companies pop up in this field, and I’m looking forward to seeing this space develop. The competition from the commercial space is bound to trigger innovation and improvements on the open source front as well.
We’re heavy users of external services for log aggregation, collecting metrics and alerting. Simply put, they know better how to run that platform than we do, and it allows us to focus on delivering the best possible customer value.
Monitoring is getting better
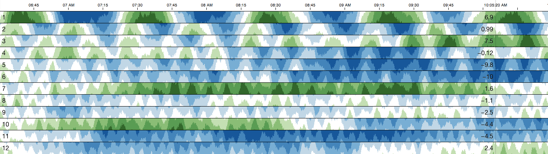
Lots of new tools have sprung up in the last two years. While development on it started earlier than that, the most prominent tools are probably Graphite and Logstash. Cubism brings new ideas on how to visualize time series data, one of the several dozens of dashboards that Graphite’s existence and flexibility by offering an API has sparked. Tasseo is another one of them, a successful experiment of having an at-a-glance dashboard with the most important metrics in one convenient overview.
It’ll still be a while until we see the ancient tools like Nagios, Icinga and others improve, but the competition is ramping up. Sensu is one open source alternative to keep an eye on.
I’m looking forward to seeing how the monitoring space evolves over the next two years.